


Into the void
- Confidence markers convey a message of dented growth but not a complete stall
- Indicators of the ‘here and now’ more worrying
- Firms rowing back on investment, employment plans
- Inflation set to outpace wage growth
- Housing market holding in ok, so far
- Upward pressure on mortgage rates
We’ve now got a smattering of indicators through the door that provide at least a steer on the initial hit from the fuel price spikes and related uncertainty.
A pothole or something deeper?
March confidence metrics predictably sagged. But not so much as to indicate an outright stalling in growth. The better guides on annual economic growth that we pull out of the ANZ and NZIER business surveys convey a message of dented growth, but still growth.
It seems clear though that the full impact of the Iranian conflict is yet to be captured. We’d thus be surprised if these confidence readings didn’t fall further. Providing a sense of the risks, the combined March services and manufacturing PMI was cause for more concern.
A dip to 46.0 in the PSI pulled the combined PMI/PSI measure down to just under 47 (a level above 50.0 denotes expansion). That level roughly accords with growth hitting stall-speed, although things can and do jump around month-to-month.
PMI/PSI back into the danger zone

Of the PSI sub-indices, easily the largest declines were recorded in the accommodation & hospitality and culture & recreation components. Both slumped into the 30s. So not only are people pulling back on going out, but the increased cost of simply getting to a show or sports event seems to be holding activity back.
The PMI/PSIs reference actual activity, in contrast to the confidence measures already mentioned that tend to be more forward-looking. Taken together, the message seems to be conditions in the here and now are weaker than what’s built into business expectations down the line.
It’s very difficult to budget or put a cost/spending/investment plan together when you can’t get a handle on your future costs or demand profile. In the absence of a bit more clarity, the default will be to remain cautious and hit pause. Yesterday’s NZIER survey confirmed investment intentions are being rowed back. A net 9% of firms now plan to reduce plant and machinery investment over the coming year, from a net 7% intending to increase investment the prior quarter.
All told, the wash up from recent weeks’ data flow hasn’t prompted a change to the shape of our growth forecasts. The first quarter looks as if it was reasonable (GDP +0.9%). But the odds of second quarter growth turning out negative (for the 3rd year running) are high and rising.
A(nother) Q2 stumble
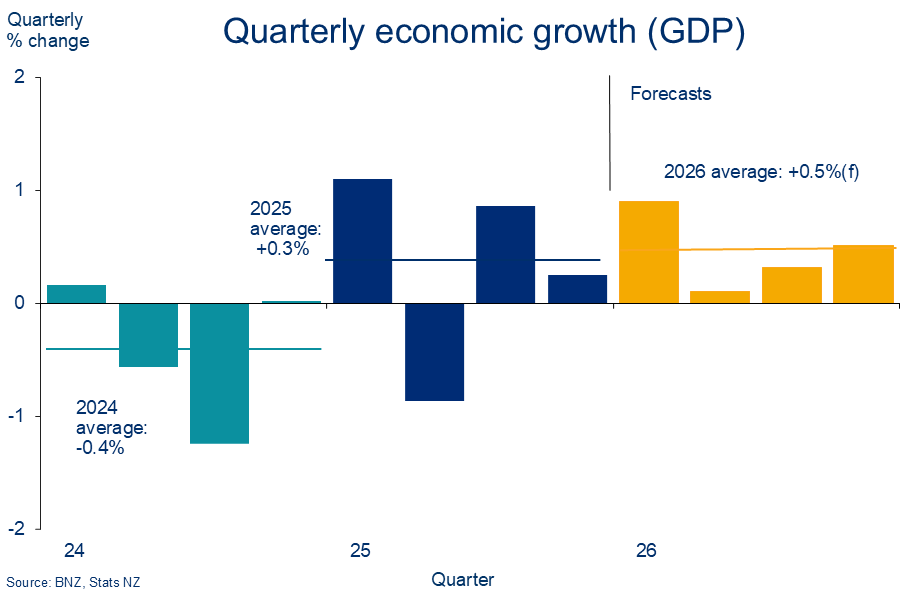
We continue to pencil in a weak recovery over the second half. This remains more an assumption than any sort of conviction forecast but some, admittedly stop-start, progress in the Middle East at least keeps it on the board.
Labour market recovery delayed…
One of the likely causalities of the economic disruption is a shunting out of the recovery in labour market conditions that was just starting to take shape.
Reduced output, higher costs, and heightened uncertainty are not conducive to additional hiring. So it was no surprise to see the NZIER survey’s labour demand measures take a knock. These measures can provide a decent lead on labour market outcomes, per the chart.
Labour demand takes a knock

According to the NZIER, a net 9% of businesses reduced staff numbers in the March quarter, with a net 5% planning on reducing numbers over the next three months.
This apparent reduction in firms’ labour requirements also needs to be set against the fact we’ve got more labour supply coming through now net migration is cycling higher again. We learned last week that net inflows, at 25k in February, are almost back to average.
The bottom line is there might be more slack opening up in the labour market, and unemployment could tick up from here. That’s a risk the employment indices of the PMIs also hinted at. Our forecast that the labour market stays weak (unemployment flatlined at 5.4%) rather than deteriorates further may, alas, prove optimistic.
…another setback for cost-of-living metrics
It’s an environment likely to keep wage growth under pressure. With inflation spiking, that’s problematic for purchasing power, and hence household spending.
Tuesday’s 3.1% read on annual inflation for Q1 was probably not far different from aggregate wage growth over the quarter (Q1 labour market data due 6 May). It highlights the pressure on aggregate ‘real’ or inflation-adjusted wage growth.
If you were to swap out headline inflation for circa-4% ‘essentials’ inflation (chart below) the picture looks even worse. And, of course, this all predates the squeeze happening now in the second quarter. We’re forecasting an inflation peak of 4.6%y/y for Q2.
Any sort of forecast currently carries with it a sizeable health warning. But the broad messaging from mashing our inflation and wage growth forecasts together is that ‘real’ or inflation-adjusted wage growth is likely to languish in negative territory for the remainder of this year. Purchasing power, at an aggregate level, going backwards in other words.
Cost living calculus problematic

The first signs of the associated pull-back in discretionary spending were clear in March retail card spending figures. Cuts to spending on hospitality (-2.4%m/m) and apparel
(-4.2%m/m) may well reflect households finding ways to absorb a whopping 17% monthly increase in fuel spending.
What gets cut to pay the fuel bill?

Housing market in a holding pattern
It was tempting to let March housing figures go through to the keeper given most of the March action would have been in train well before the fuel shock. Any trends gleaned thus risk being overtaken by events.
Still, you couldn’t completely ignore the sturdy overtones in the data. According to the REINZ HPI, house prices rose for the second consecutive month (+1% cumulatively, s.a), with prices in Auckland (+1.2% since Jan) and Wellington (+0.9% since Jan) even showing signs of life. Houses also sold a little faster in nearly all parts as well.
It was enough, all told, to prevent any further pruning of our flat house price forecast for calendar 2026, following last month’s trim (detail here).
The chatter now seems to be all about the potential for any housing momentum that may have existed to be snuffed out by the darkening economic and geopolitical clouds. We don’t disagree but, in our view, the bigger threat is the recent lift in mortgage rates, and chances of more to come.
House prices still flat, especially in the North Island

Mortgage rate pressure remains
There were a few additional upward tweaks to mortgage rates last week. Average 1-3-year fixed rates across the four majors are now up 15-40bps so far this year.
Financial markets have continued to front-load when lifts in the Official Cash Rate (OCR) might occur. That follows the Reserve Bank’s broad “when, not if” messaging from its April announcement and Q1 inflation figures printing on the firmer side of market expectations.
A 25bps lift by July is now fully baked into market pricing, with a further two hikes implied by the end of the year. If this pricing was sustained/delivered, it would – all else equal – see one and two year wholesale rates lift in the order of 30-50bps over the coming six months, with similar implications for fixed mortgage rates.
We’re not forecasting such an outcome but nor are we inclined to push back aggressively given the wide range of plausible scenarios and the Reserve Bank’s intent on returning inflation to target. It’s a risk worth thinking about. As things stand now, there’s probably some lingering upward pressure on fixed mortgage rates from recent gains in wholesale rates.
Upward pressure

We haven’t changed our pick of September as the ‘least unlikely’ timing for a lift in the OCR. Navigating a supply shock is tricky and throws off risks in all directions. There’s clearly a live debate. But if we had to sway the risk profile round our central view one way or the other, we’d lean toward an earlier start.
Pulling the threads together, we remain of the view mortgage rates are likely to keep pushing higher this year, albeit at a gentler rate than implied by current market pricing. The chart below illustrates our forecast for the 2-year fixed mortgage rate.
If the recent uptrend is maintained, the lagged pass-through from last year’s rate cuts into the average mortgage rate being paid – the easing ‘pipeline’ – is probably close to done. This rate fell to 4.93% in February according to RBNZ data, from a peak of 6.39% in late 2024.
Based on our forecasts, we estimate it will hold around this 4.9% level for the next few months before starting to grind higher in the latter part of the year.
Mortgage relief close to done

To subscribe to Mike's updates click here.


First, please LoginComment After ~